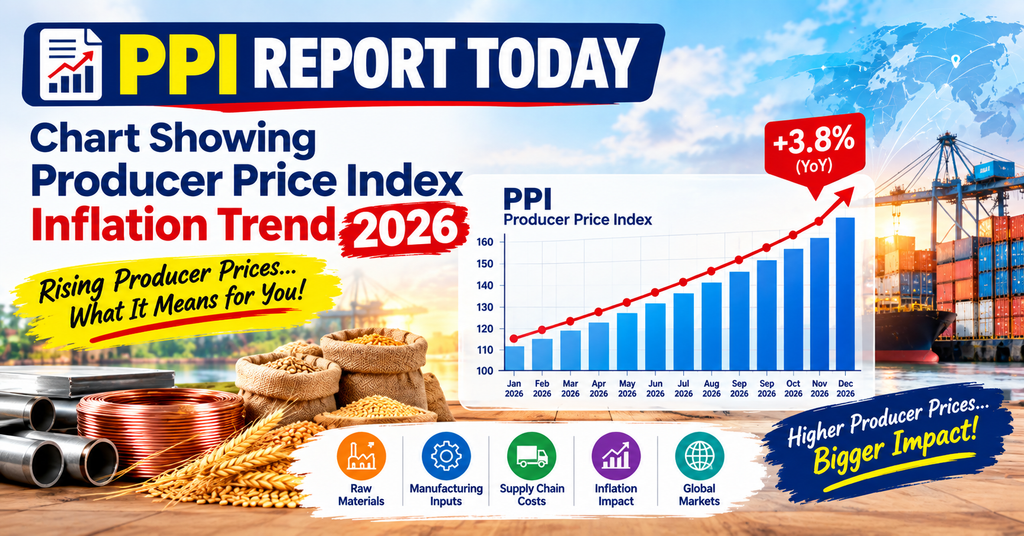
PPI Report Today: Shocking Producer Price Surge 2026
The PPI report today is making headlines across financial media, and for good reason. The Bureau of Labor Statistics has just released its Producer Price Index figures for August 2026, and the numbers show a notable acceleration in wholesale-level inflation. If you’ve been wondering what the PPI report today actually means, why economists are talking about it, and how it might affect the prices you pay at checkout, this guide breaks it all down in plain language.
Whether you’re an investor watching the bond market, a small business owner planning next quarter’s budget, or simply a shopper trying to understand why your grocery bill keeps climbing, the PPI report is one of the most important — and most misunderstood — economic releases of the month. Let’s walk through exactly what happened, why it happened, and what comes next.
What Is the PPI Report, Exactly?
The Producer Price Index (PPI) tracks the average change over time in the prices that domestic producers receive for their goods and services. Unlike the Consumer Price Index (CPI), which measures what shoppers pay at the register, the PPI measures prices further up the supply chain — at the factory gate, the wholesaler, and the distributor level.
Because producer costs eventually get passed along to consumers, the PPI report is often described as a leading indicator of consumer inflation. When wholesale prices for raw materials, packaging, transportation, and energy rise, retailers usually respond in one of two ways: absorb the cost and shrink their margins, or pass the increase on to shoppers. In an environment where margins are already thin, the second option tends to win out, which is exactly why analysts, retailers, and everyday consumers keep a close eye on every new PPI report.
The Latest PPI Report Today: August 2026 Numbers
According to the Bureau of Labor Statistics, the headline PPI for final demand climbed 0.4 percent in August 2026. Within that figure, prices for final demand goods jumped a striking 1.1 percent, while prices for final demand services rose a more modest 0.1 percent. On a year-over-year basis, final demand prices are now running about 5.4 percent higher than they were twelve months earlier.
That 1.1 percent monthly jump in goods prices is the standout figure in this PPI report today, and it represents one of the larger single-month increases seen this year. Goods-producing industries are typically more sensitive to swings in commodity and energy markets, so a spike of this size usually points to specific cost pressures — think fuel, freight, metals, or agricultural inputs — rather than a broad, even increase across the entire economy.
Services inflation, by contrast, stayed relatively tame at 0.1 percent for the month. Services make up a large share of the U.S. economy, so a subdued reading here is a modest silver lining even as goods prices surge. Still, when you combine a hot goods number with a 5.4 percent annual pace for total final demand, it’s clear this PPI report is not a “nothing to see here” release — it’s one that deserves real attention.
Why This PPI Report Matters for Everyday Prices
It’s tempting to treat producer price data as something only economists and traders care about, but the reality is more personal than that. Every dollar increase in what a manufacturer pays for steel, plastic, packaging, or diesel fuel eventually shows up somewhere else — usually on a store shelf or in a shipping fee.
Here’s the chain reaction that a strong PPI report like this one can set off:
- Raw material and input costs rise at the factory or farm level.
- Manufacturers and wholesalers pass some of that cost along to retailers.
- Retailers adjust shelf prices, either immediately or over the following one to three months, to protect their margins.
- Consumers see the effect in the Consumer Price Index a month or two after the PPI signal first appears.
This lag is exactly why market watchers treat the PPI report today as an early warning system. A hot PPI reading doesn’t guarantee that CPI inflation will spike at the same pace next month, but it does raise the odds — especially when the increase is concentrated in goods categories like energy, food inputs, and industrial materials, as it was in August 2026.
Goods vs. Services: Where the Pressure Is Coming From
One of the most useful things a PPI report can tell you is where inflation is originating. In August, the split between goods and services was dramatic — goods prices rose more than ten times faster than services prices. That kind of gap usually traces back to a handful of volatile categories:
- Energy costs: Diesel, gasoline, and jet fuel prices have been a recurring driver of goods-side inflation throughout 2026, showing up repeatedly in the intermediate-demand data that feeds into the final PPI report.
- Industrial materials: Nonferrous metals, scrap, and basic organic chemicals have also pushed higher in recent monthly releases, adding cost pressure for manufacturers of everything from electronics to packaging.
- Freight and transportation: Truck transportation of freight has been another repeat contributor, meaning the simple cost of moving goods from a factory to a warehouse to a store is climbing.
Services, on the other hand, include categories like portfolio management, trade margins, and warehousing — areas that have been comparatively stable. That’s part of why the headline PPI report today looks so lopsided between the two major components.
How the PPI Report Compares to the CPI
A common point of confusion is the difference between the PPI and the CPI. Both are inflation gauges, but they measure different stages of the economy:
- PPI (Producer Price Index): Measures price changes from the seller’s perspective — what producers receive for their output.
- CPI (Consumer Price Index): Measures price changes from the buyer’s perspective — what households actually pay for goods and services.
Because the PPI report captures cost pressure before it reaches store shelves, it’s often used alongside CPI data to build a fuller picture of the inflation pipeline. A rising PPI with a lagging CPI can suggest that retailers haven’t yet passed on higher costs — which, in turn, can hint that consumer prices may still have room to climb in the coming months.
What the Bond Market and the Fed Are Watching in This PPI Report
Beyond retail prices, the PPI report today carries weight in financial markets. Bond traders scrutinize producer price data because it feeds into expectations about the Federal Reserve’s next move on interest rates. A PPI reading that comes in hotter than forecast — as August’s did relative to expectations — can push yields higher, since it raises the odds that the central bank will need to keep monetary policy tighter for longer to bring inflation back toward its target.
Equity markets tend to react as well, particularly in sectors sensitive to input costs, like manufacturing, retail, and transportation. A strong PPI report can squeeze profit-margin expectations for companies that haven’t yet raised their own prices, while companies with strong pricing power may be seen as better insulated from the trend.
What’s Next: The September PPI Report
The Bureau of Labor Statistics has already scheduled the next release. The PPI report covering September 2026 data is set to publish on October 15, 2026, at 8:30 a.m. Eastern Time. Analysts will be watching closely to see whether August’s goods-price spike was a one-month event tied to volatile categories like energy, or the start of a more persistent trend.
If the next PPI report today headline continues to show goods prices outpacing services, expect renewed conversations about the durability of current interest rate policy and continued pressure on retail pricing. If instead the increase cools off, it could ease some of the concern that built up around this latest release.
What This PPI Report Means for Shoppers Right Now
For everyday consumers, the practical takeaway from this PPI report is simple: expect some retail categories — particularly those tied to fuel, packaged goods, and anything shipped by truck — to see continued price pressure over the next one to three months as producers pass along higher costs.
That makes it more important than ever to shop smart. Comparing prices across retailers, watching for seasonal sales, and buying during promotional windows can meaningfully offset the squeeze from rising wholesale costs. Online marketplaces that regularly rotate deals and discounts — such as ShopOpen24 — can be a useful way to find lower prices on everyday goods even as producer-level inflation works its way through the supply chain. Keeping an eye on both the macro data (like each new PPI report) and your own household budget is the most reliable way to stay ahead of rising costs.
PPI Report FAQ
What does the PPI report measure? The PPI report measures the average change in selling prices received by domestic producers for their goods and services, tracking inflation from the seller’s side of the transaction rather than the buyer’s.
Is the PPI report the same as the inflation rate? Not exactly. The PPI is one of several official inflation gauges. It’s often viewed as a leading indicator for the CPI, which is the more commonly cited “inflation rate” that reflects what consumers pay.
Why did the PPI report show goods rising faster than services? In the August 2026 report, goods prices were driven higher by categories like energy, industrial metals, and freight transportation, while services categories remained comparatively stable.
When is the next PPI report released? The next PPI report, covering September 2026 data, is scheduled for release on October 15, 2026, at 8:30 a.m. Eastern Time.
How does the PPI report affect prices at the store? Producer-level cost increases typically get passed along to consumers over the following one to three months, meaning a hot PPI report can be an early signal of retail price increases to come.
Final Thoughts on Today’s PPI Report
This month’s PPI report is a reminder that inflation pressure hasn’t fully disappeared from the U.S. economy — it’s simply shifted where it shows up most visibly. A 0.4 percent monthly increase in final demand prices, driven heavily by a 1.1 percent jump in goods, keeps annual producer inflation running well above the Federal Reserve’s long-term comfort zone.
For now, the smartest move for both businesses and shoppers is the same: stay informed, watch the data as it rolls in, and adjust spending and pricing decisions accordingly. Mark your calendar for October 15 for the next PPI report today release, and in the meantime, keep an eye on where you’re shopping — smart comparison shopping through platforms like ShopOpen24 is one practical way to soften the impact of rising producer costs on your own budget.
Sources: U.S. Bureau of Labor Statistics (bls.gov/ppi), Federal Reserve Bank of St. Louis (fred.stlouisfed.org).